[elk]beats, elk stack 데이터 쌓고 시각화해보기
오늘은 elk스택를 구성해보자. 구성은 아래와 같다.

elk를 시작하는 가장 빠른 방법은 docker-compose를 이용하는 것이다.
1. git clone
먼저 깃에서 Clone해준다.
git clone https://github.com/teichae/docker-elk이번 포스팅에서는 로컬에서 elk를 실행하기때문에 elk의 호스트 설정은 건너뛰도록 한다.
각각의 컨피그 파일은 아래 위치에서 확인 가능하다.
vi ./docker-elk/elasticsearch/config/elasticsearch.yml
vi ./docker-elk/kibana/config/kibana.yml
vi ./docker-elk/logstash/config/logstash.yml
2. logstash 설정
filebeat와 logstash를 연동하기 위해 설정을 해준다.
아래 파일을 수정해준다.
vi ./docker-elk/logstash/pipeline/logstash.confinput {
beats {
port => 5000 # 5000번 포트로 beat에서 보내주는 데이터를 받는다
codec => json
}
}
# 필터 -> 제외할 칼럼
filter {
mutate {
remove_field => ["@version","@timestamp","beat","prospector","fields","inout_type","offset","source","type","host","tags","log","input"]
}
}
output {
elasticsearch {
hosts => "elasticsearch:9200" # es주소:포트
index => "seoul-metro-dashboard" # es에 데이터를 입력할 index
# user => "username" # optional
# password => "password" # optional
}
}
여기서 es에 아직 index를 생성하지 않았기 때문에 나중에 생성해줘야한다. 일단 작성하고 저장한다.
3. 도커 컴포즈 실행
-d는 백그라운드에서 실행하는 옵션이다. 실시간으로 로그를 확인하고싶다면 -d옵션을 빼면 된다.
cd docker-elk
docker-compose up -d
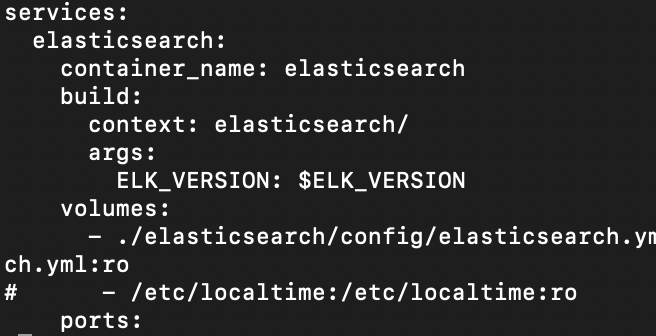
[에러모음]
for elasticsearch  Cannot start service elasticsearch: Mounts denied:
The path /etc/localtime
-> docker-compose.yml 파일에서 - /etc/localtime:/etc/localtime:ro 부분을 주석처리 해준다. -> logstash나 kibana에서 발생했을 때도 동일하게 해결
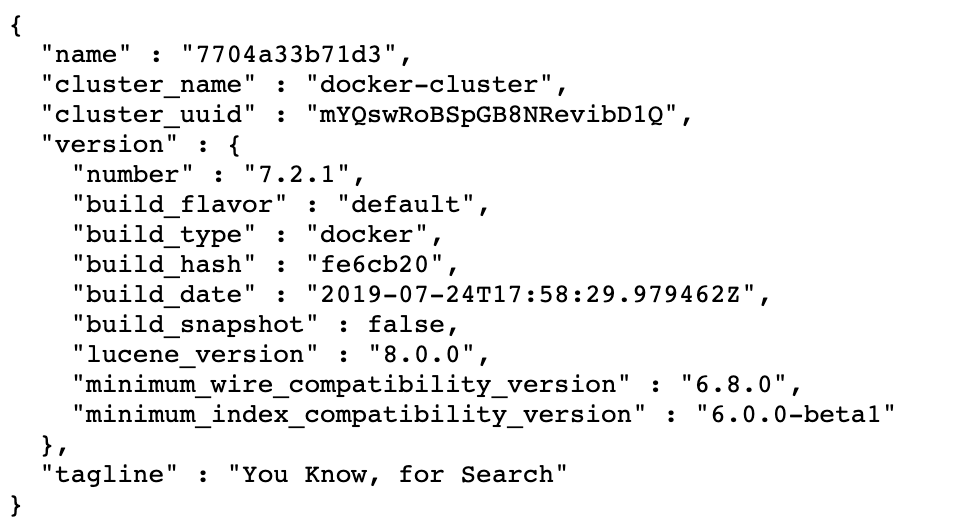
4. 확인
1. elasticsearch
http://localhost:9200/
2. kibana
http://localhost:5601/
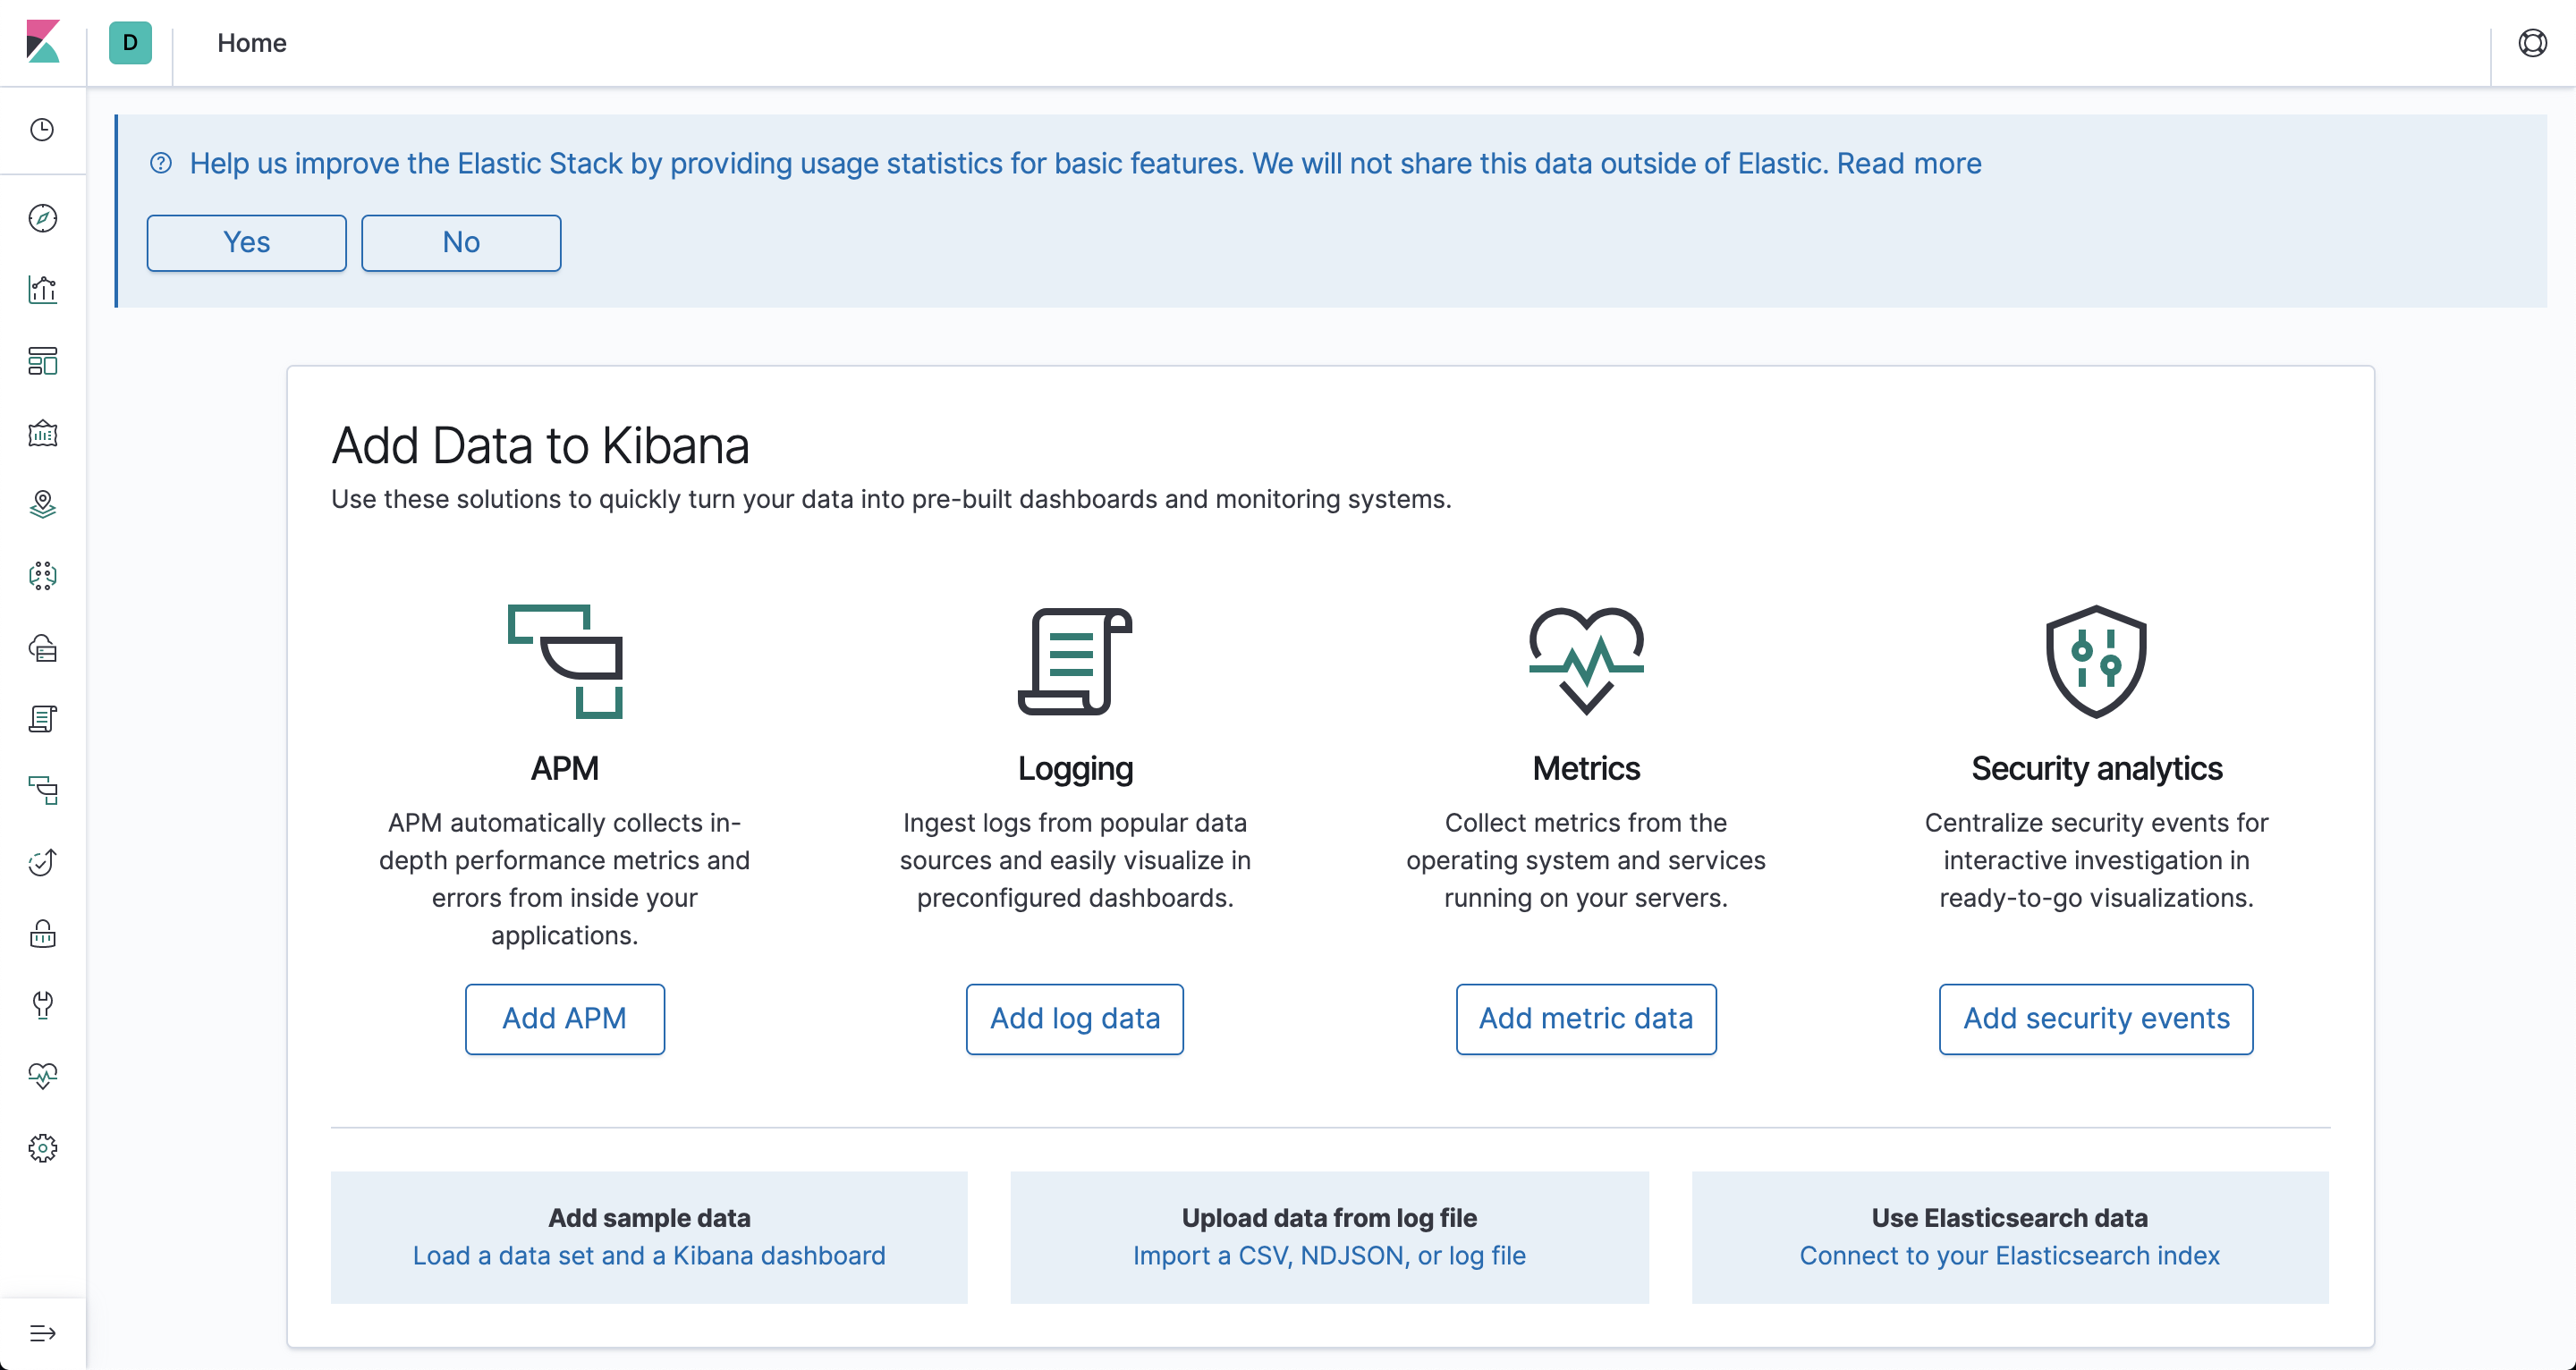
이제 성공적으로 elk스택을 실행했다.
5. index 생성
로그스태시에서 설정했던 seoul-metro-dashboard index를 생성해보자.
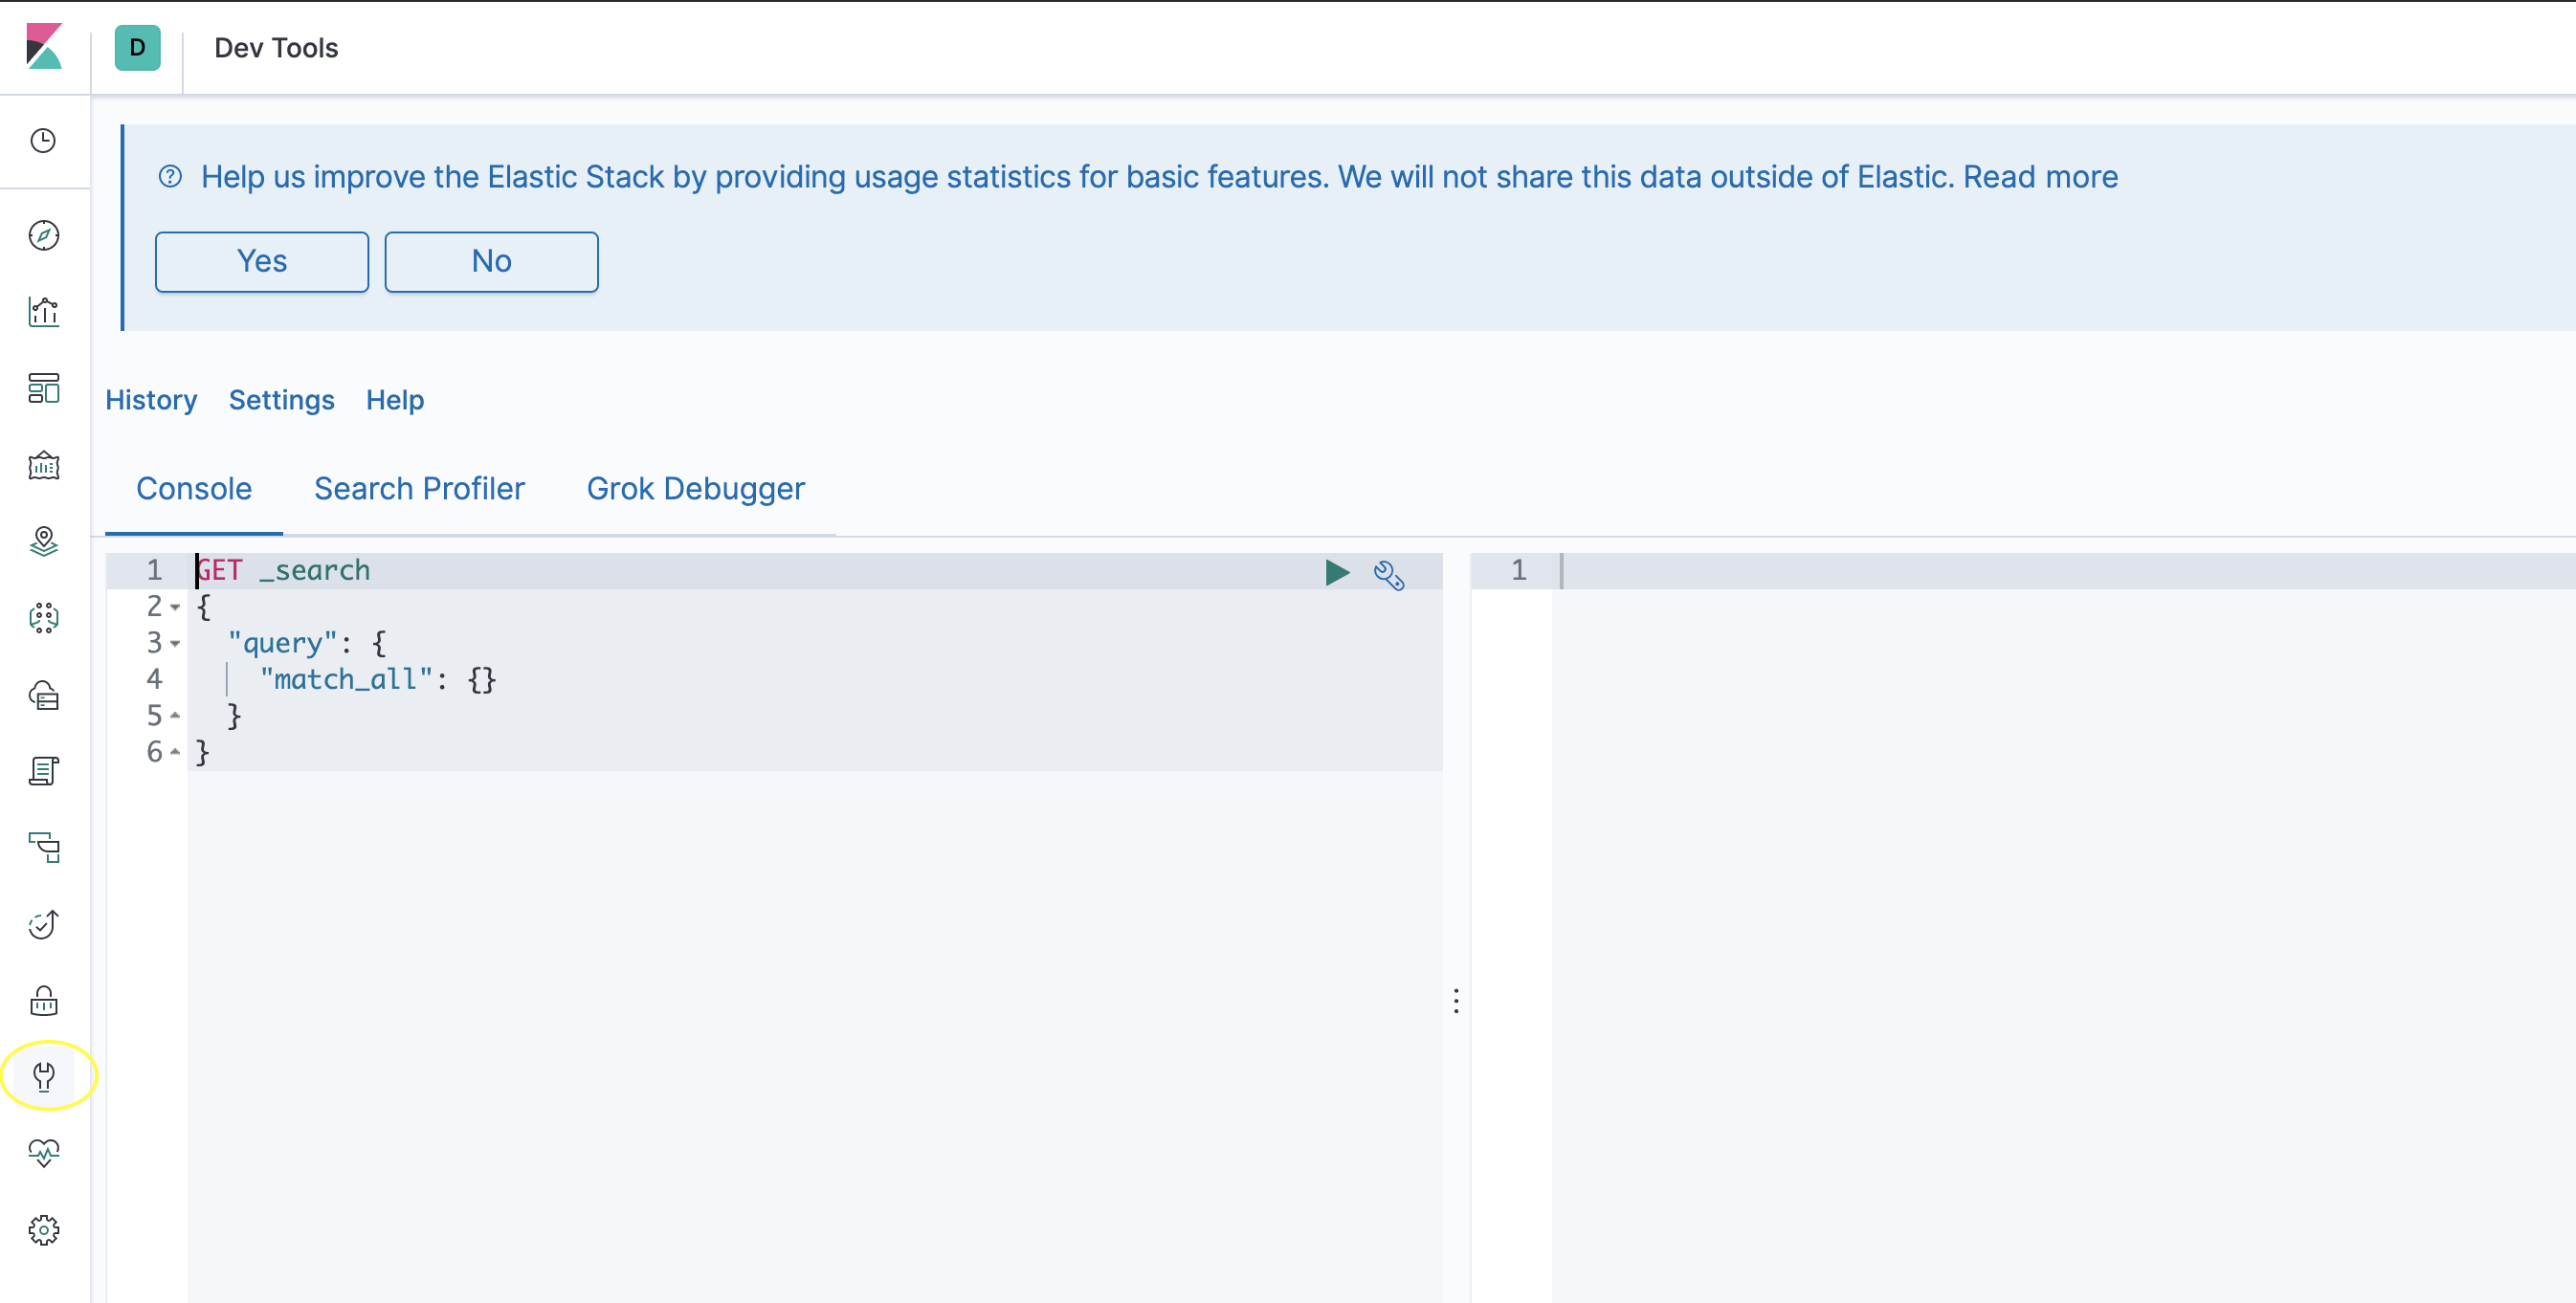
왼쪽네비에서 dev tool을 선택하면 쉽게 es 명령어를 입력할 수 있다. 인덱스를 만드는 아래 내용을 입력한 후 실행시켜준다.
PUT seoul-metro-dashboard
{
  "mappings": {
      "properties": {
        "time_slot" : {"type":"date"},
                "line_num" : {"type":"keyword","index":true},
                "line_num_en" : {"type":"keyword","index":true},
                "station_name" : {"type":"keyword","index":true},
                "station_name_kr" : {"type":"keyword","index":true},
                "station_name_en" : {"type":"keyword","index":true},
                "station_name_chc" : {"type":"keyword","index":true},
                "station_name_ch" : {"type":"keyword","index":true},
                "station_name_jp" : {"type":"keyword","index":true},
                "station_geo" : {"type" : "geo_point"},
                "people_in" : {"type" : "integer"},
                "people_out" : {"type" : "integer"}
        }
      }

  }
index가 성공적으로 만들어졌다.

6. filebeat 설정
이제 filebeat에서 logstash로 데이터를 넣기 위해 filebeat를 다운받자
curl -L -O https://artifacts.elastic.co/downloads/beats/filebeat/filebeat-7.9.1-darwin-x86_64.tar.gz
tar xzvf filebeat-7.9.1-darwin-x86_64.tar.gz
cd filebeat-7.9.1-darwin-x86_64

vi filebeat.yml
filebeat.yml 파일을 수정해준다.
# ============================== Filebeat inputs ===============================

filebeat.inputs:

# Each - is an input. Most options can be set at the input level, so
# you can use different inputs for various configurations.
# Below are the input specific configurations.

- type: log

  # Change to true to enable this input configuration.
  ## true로 변경
  enabled: true

  # Paths that should be crawled and fetched. Glob based paths.
  paths:
    - /Users/yearang/Desktop/logs/*.log		## 로그파일의 위치, *로 와일드카드 사용가능
    #- c:\programdata\elasticsearch\logs\*

  # Exclude lines. A list of regular expressions to match. It drops the lines that are
  # matching any regular expression from the list.
  #exclude_lines: ['^DBG']


  # ================================== Outputs ===================================

# Configure what output to use when sending the data collected by the beat.

# ---------------------------- Elasticsearch Output ----------------------------
## es로 보내지 않기 때문에 주석처리
#output.elasticsearch:
  # Array of hosts to connect to.
  # hosts: ["localhost:9200"]	# 주석처리

  # Protocol - either `http` (default) or `https`.
  #protocol: "https"

  # Authentication credentials - either API key or username/password.
  #api_key: "id:api_key"
  #username: "elastic"
  #password: "changeme"

# ------------------------------ Logstash Output -------------------------------
## 주석해제
output.logstash:
  # The Logstash hosts
  hosts: ["localhost:5000"]		## ip:5000

  # Optional SSL. By default is off.
  # List of root certificates for HTTPS server verifications
  #ssl.certificate_authorities: ["/etc/pki/root/ca.pem"]

  # Certificate for SSL client authentication
  #ssl.certificate: "/etc/pki/client/cert.pem"

  # Client Certificate Key
  #ssl.key: "/etc/pki/client/cert.key"
7. filebeat 실행
저장 후 filebeat를 실행시켜준다.
./filebeat -e -c filebeat.yml
es에서 쿼리를 날려서 실시간으로 데이터가 들어오는 것을 확인할 수 있다.
GET /seoul-metro-dashboard/_count
8. kibana를 이용한 시각화
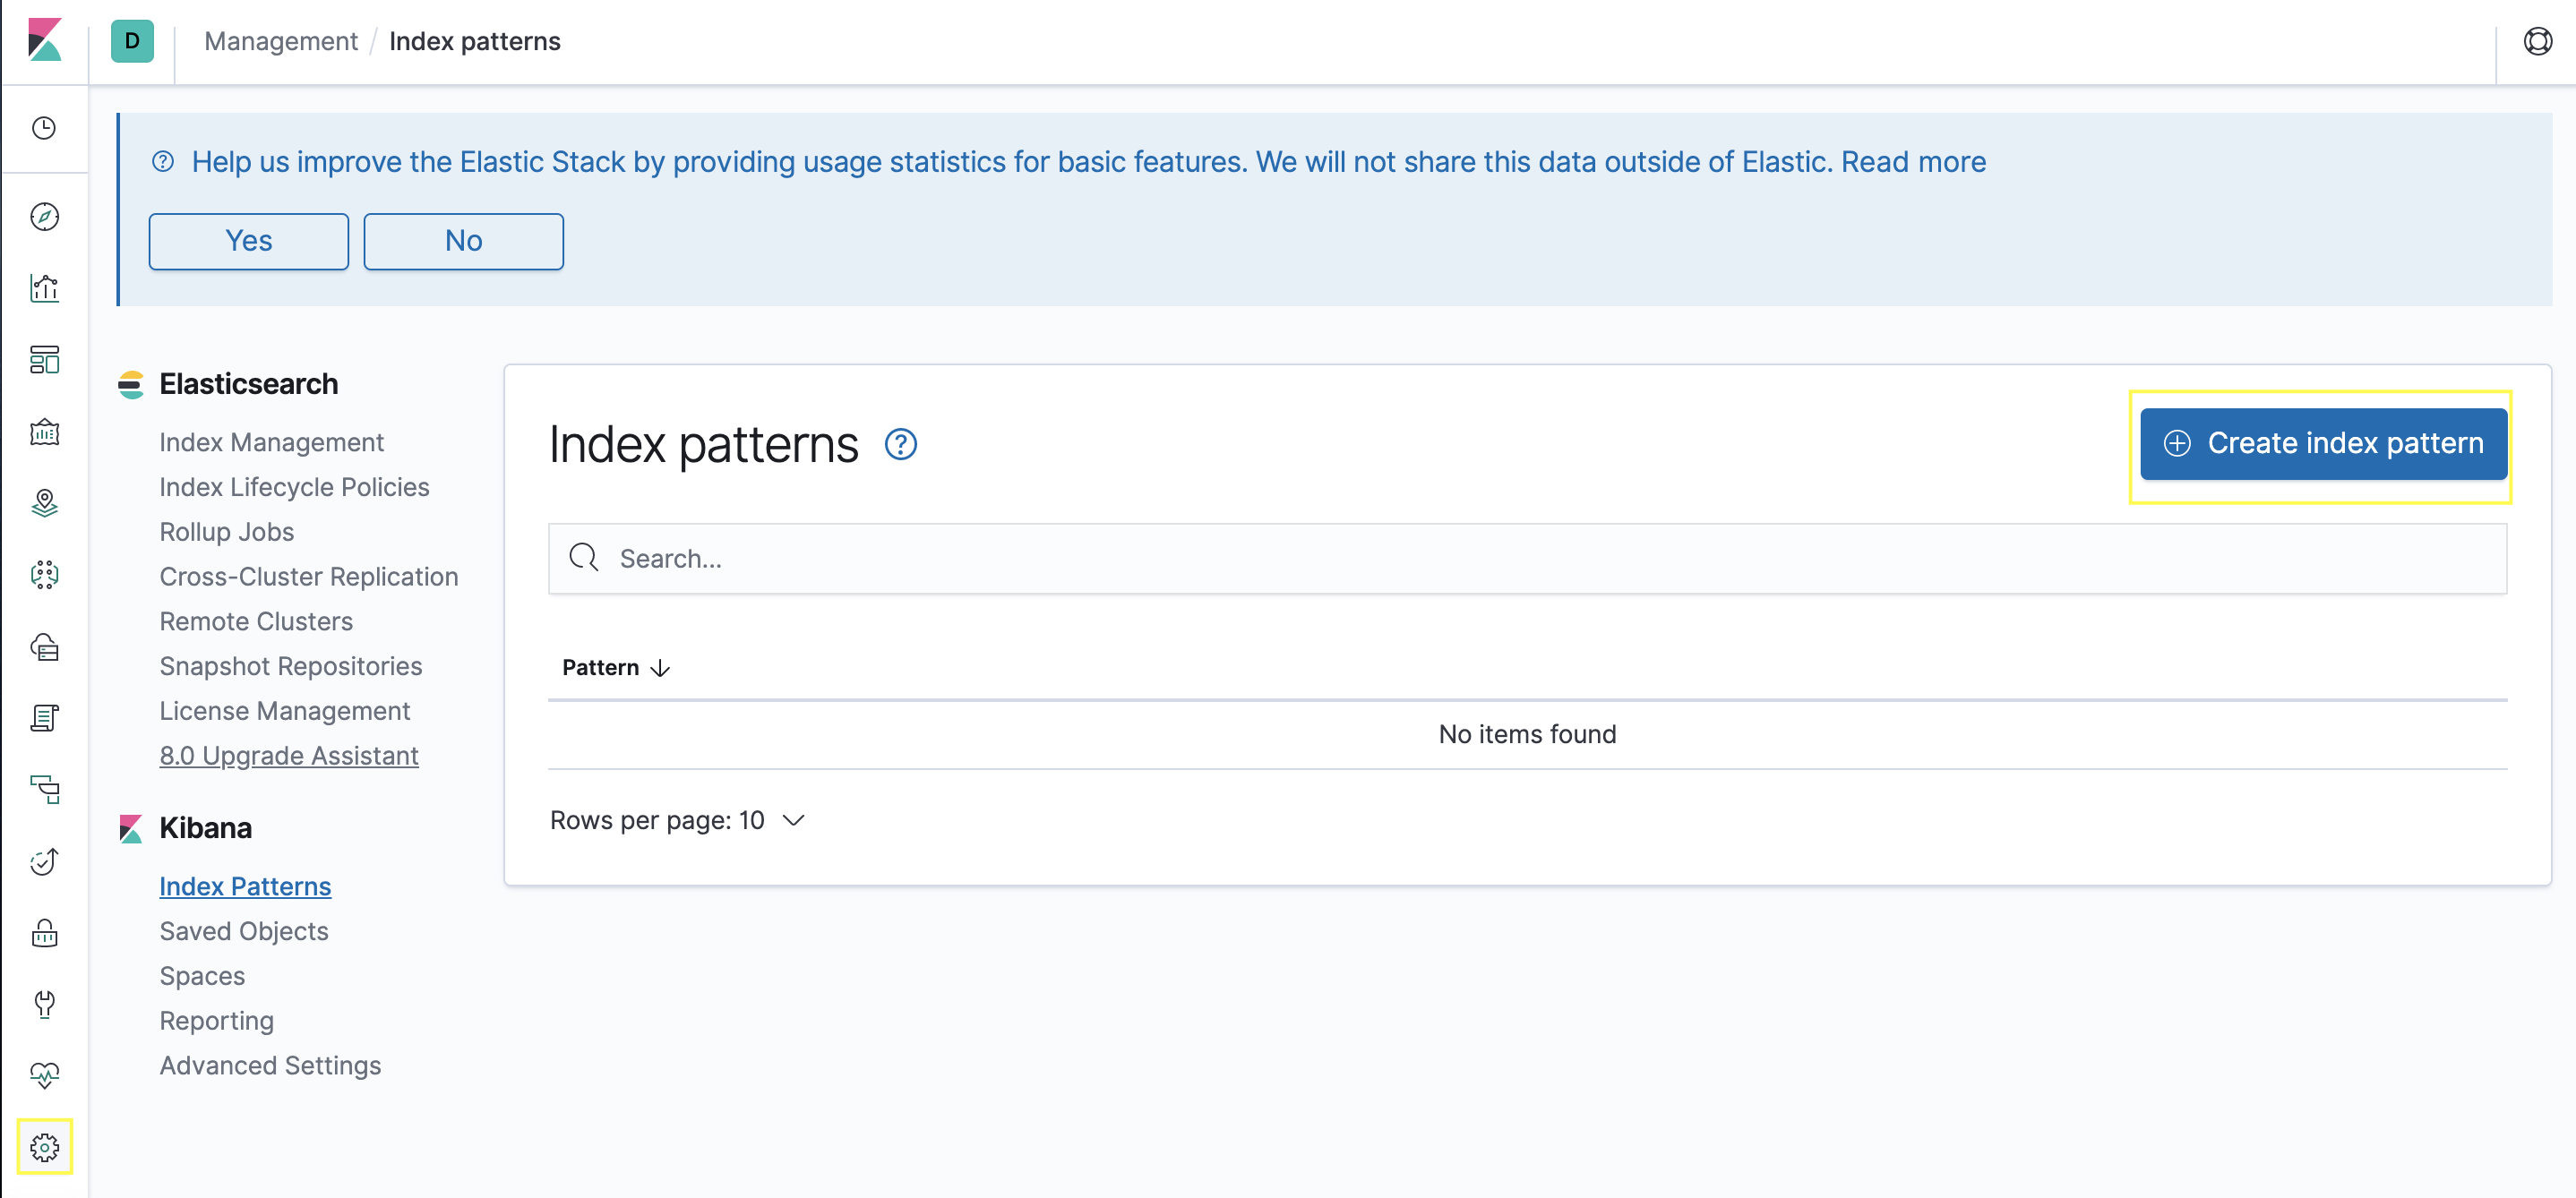
1. index pattern 만들어주기
- 키바나에서 시각화를 하기위해선 우선 index pattern을 만들어줘야한다. 왼쪽 네비에서 management > Create index pattern 을 클릭해준다.
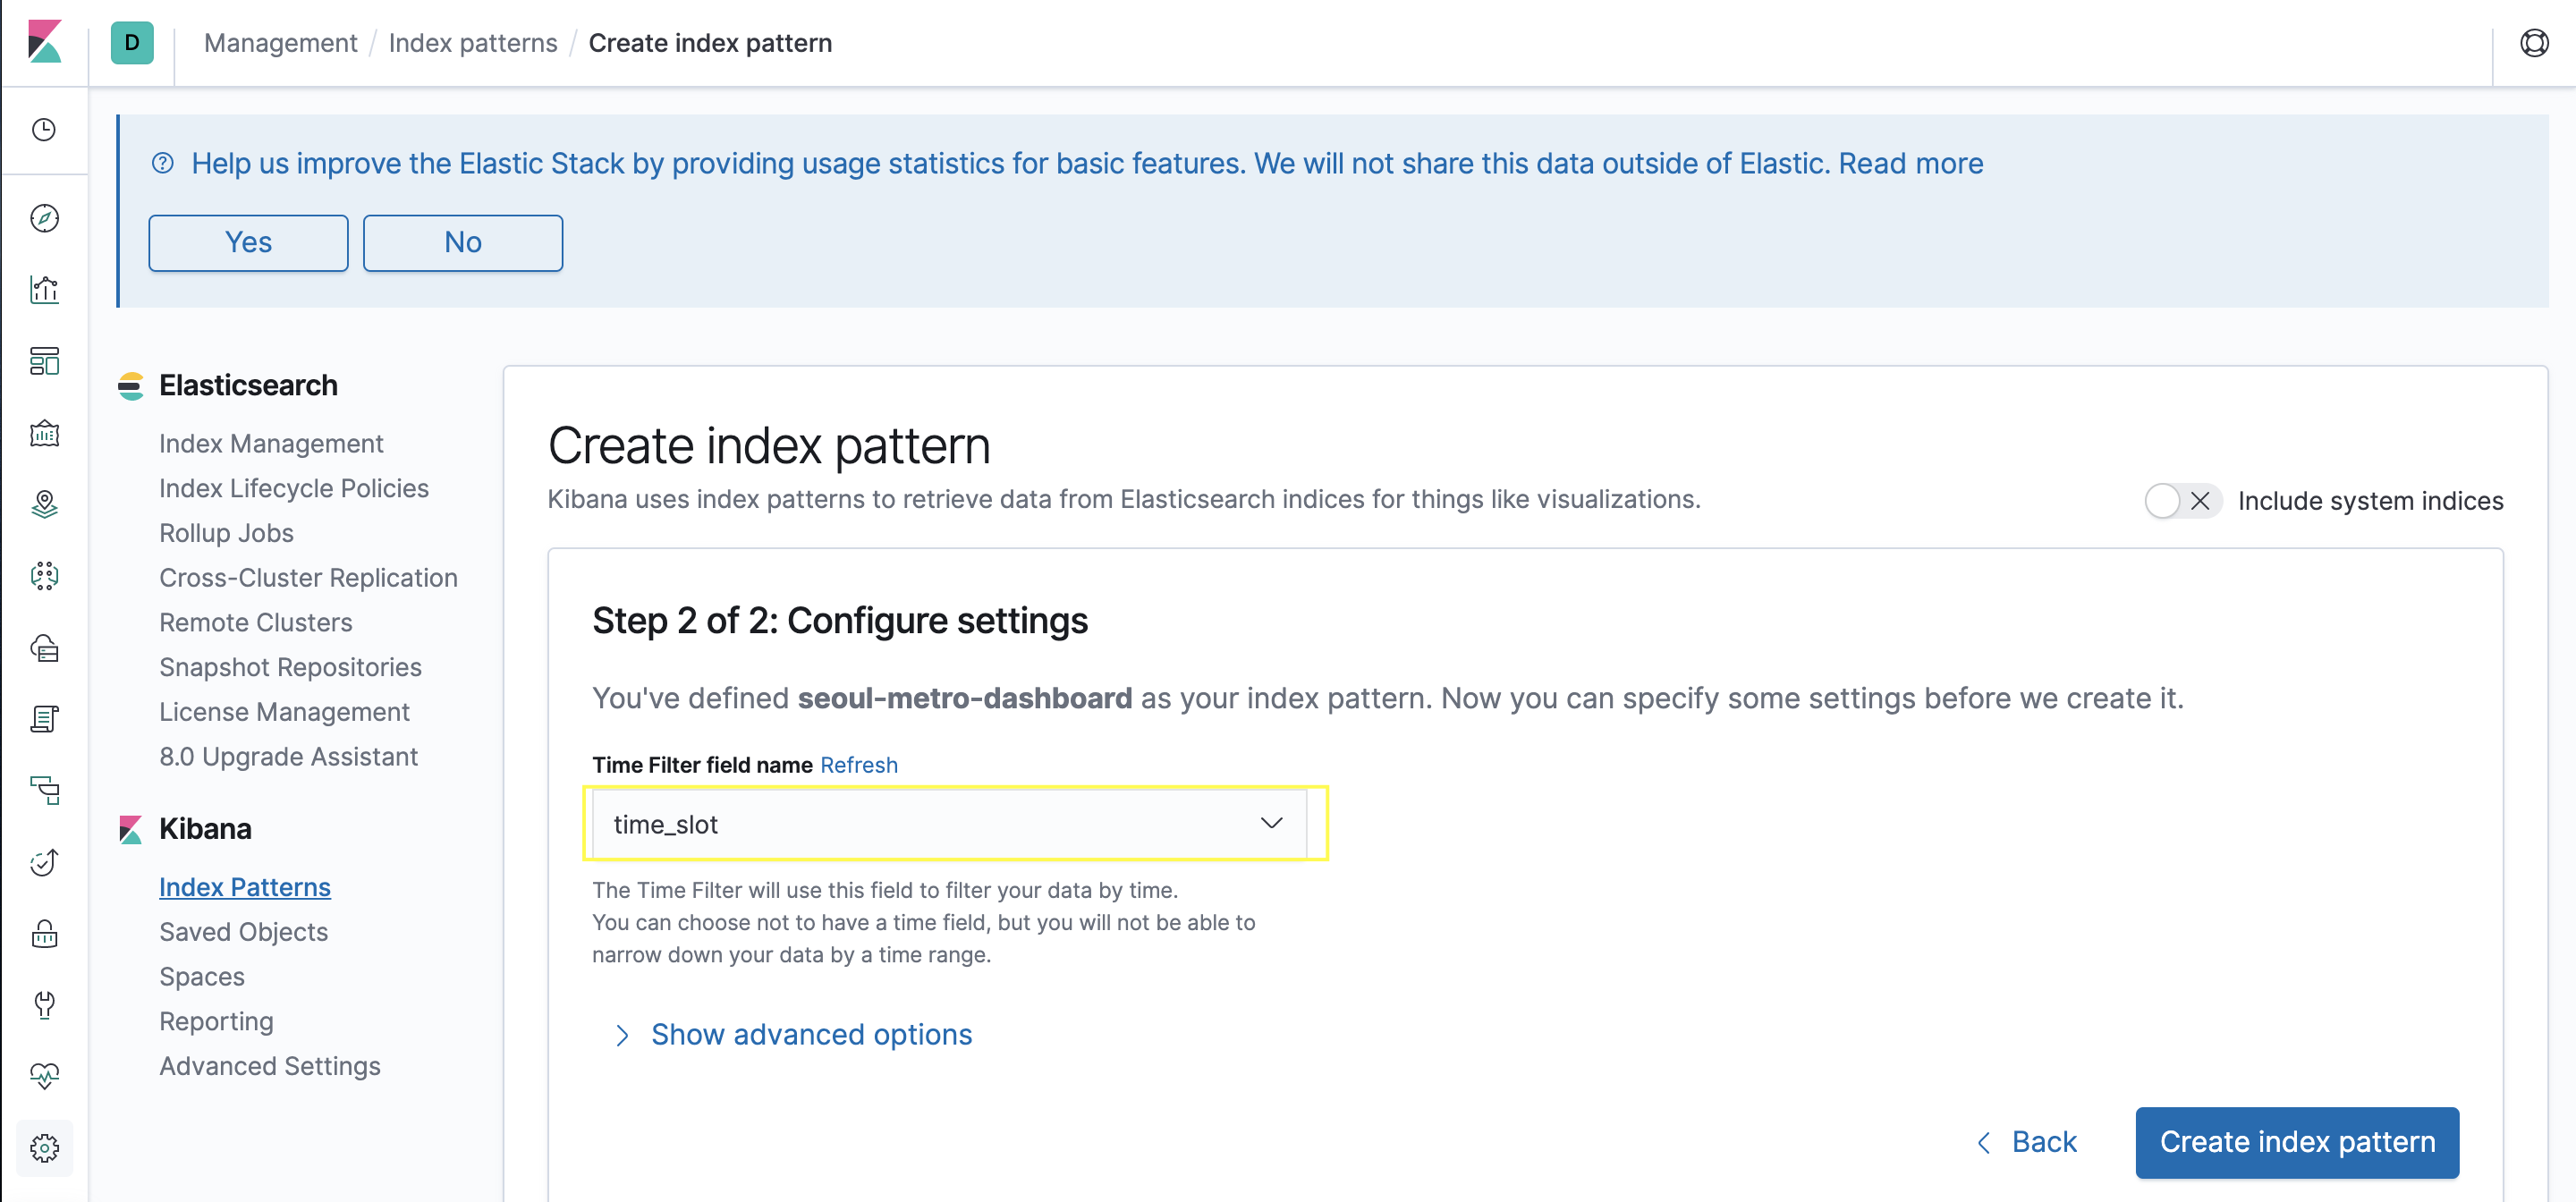
- index pattern에 index명을 입력해주고 next step을 클릭한다.

- Time Filter filed name에 시간을 나타내는 필드를 선택해준다.
2. Dashboard 생성
왼쪽 네비 Dashboard > Add

Create new visualization

원하는 타입을 선택한다.

index pattern 선택하고 설정을 조정해 그래프를 그려준다.


[References]
https://teichae.tistory.com/entry/Docker-Compose를-이용하여-ELK-Stack-시작하기-1